
What is forecasting?
Forecasting is simply a method of predicting what may happen in the future by looking at what has happened before and what is happening now.
It does not mean we know exactly what will happen. It means we use past information to make a reasonable prediction about what is likely to happen next.
We actually do this all the time.
Imagine you want to ask your mom for a day off from school.
Every time you ask her on Monday, she says no. But on Wednesday, sometimes she allows it.
After this happens again and again, you already start predicting her answer.
Monday? Probably no.
Wednesday? Maybe I have a chance.
Why?
Because you have previous experience.
In data science, those previous observations become historical data.
So forecasting is basically this:
Look at what happened before, understand how things usually behave, and use that to predict what may happen next.
We already experience prediction every day
Think about texting.
You type:
It rained, so the road was…
and your keyboard may suggest:
wet
It is not imagining a wet road like a human would. It has recognized patterns in language and predicts what word is likely to come next.
Large language models do something similar on a much larger scale.
Forecasting is not exactly the same as next-word prediction, but the basic idea is similar.
We use previous information and patterns to predict something we have not seen yet.
That could be tomorrow’s traffic, next month’s electricity demand, rainfall, sales or passenger numbers.
Trends and patterns are not the same thing
Two important ideas in forecasting are trend and pattern.
A trend tells us the direction something is moving in.
Imagine your pocket money increases every month.
January: Rs 5,000
February: Rs 5,100
March: Rs 5,200
April: Rs 5,300
By May, you will probably expect around Rs 5,400.
That is an upward trend.
It does not have to increase by exactly the same amount every month. The important thing is the general direction.
A pattern is something that keeps happening in a recognizable way.
Imagine you get Rs 4,000 every month.
January: Rs 4,000
February: Rs 4,000
March: Rs 4,000
You will probably expect Rs 4,000 again next month.
That is a pattern.
So I like to remember it this way:
A trend tells you where something is going. A pattern tells you what keeps happening.
What is seasonality?
Seasonality is simply a repeating pattern connected to time.
If a shop’s demand rises every December, year after year, that is seasonality.
The same thing can happen with weather. If certain months usually receive more rain, we may expect those months to be rainy again.
But forecasting never means:
It will definitely happen.
It means:
Based on previous data, it is more likely to happen.
But real life does not always follow the pattern
Go back to the example of your mom.
She normally says no on Monday.
Then one Monday she says yes because you are sick.
Does that mean the whole pattern has changed?
Probably not.
Something unusual happened.
Real-world data behaves like this too.
What is noise?
Noise is the irregular or unpredictable part of data.
Imagine a school road that is normally busy every weekday at 8 a.m.
Then one Thursday it is almost empty because a holiday was announced the night before.
That day does not follow the usual pattern.
Noise can come from unexpected events, temporary problems, bad weather or even incorrectly recorded data.
What is an outlier?
An outlier is a value that is unusually different from what we normally see.
If around 500 cars normally use the school road, but one day only 30 cars appear, that may be an outlier.
Maybe the school was closed.
Maybe the road was blocked.
Or maybe the traffic sensor was wrong.
So when we see an outlier, we should first ask:
Why did this happen?
Sometimes it is an error. Sometimes it tells us something important.
How far into the future are we predicting?
This is called the forecast horizon.
It simply means how far ahead we are trying to predict.
Tomorrow?
Next month?
Three years from now?
Usually, the further we try to predict, the more uncertainty we have.
Predicting tomorrow’s traffic is easier because we already know the day, whether school is open and maybe even the weather.
Predicting traffic three years from now is harder because many things can change.
So near-term forecasts are usually more precise than long-term forecasts.
How much historical data do we need?
There is no fixed answer.
It depends on what we are trying to predict.
If you want to understand what normally happens every Sunday, several weeks may give you useful data.
But if you want to understand what normally happens every December, you would ideally want to see several previous Decembers.
The important thing is not simply having more data.
It is having relevant and reliable data.
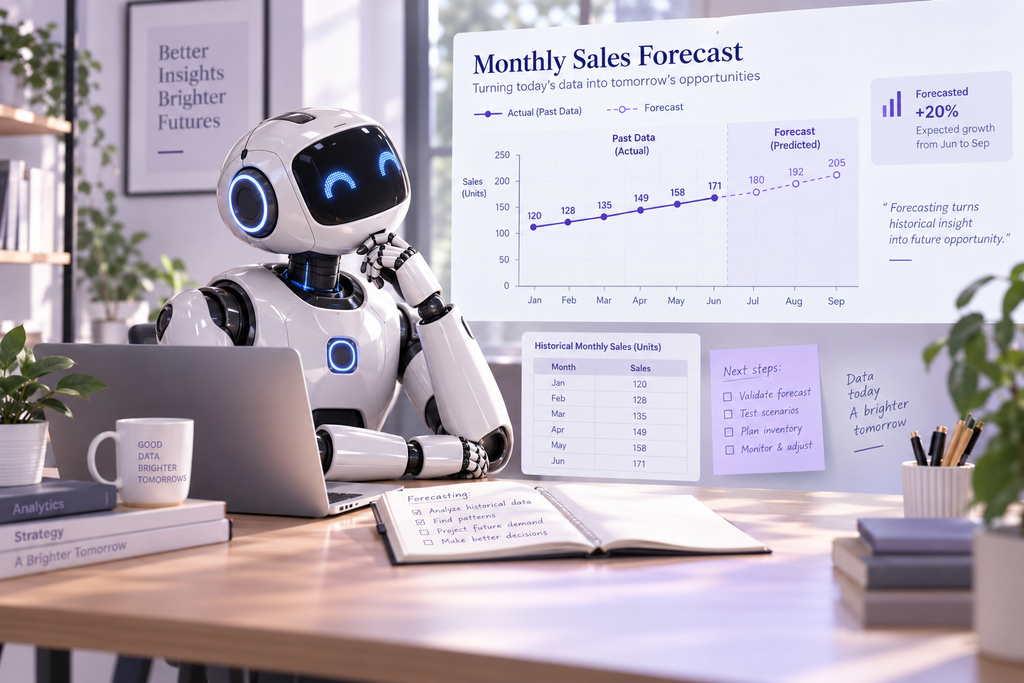
What is a time series?
When data is recorded over time, we call it a time series.
For example:
daily temperature
monthly sales
hourly electricity use
weekly passenger numbers
The order matters because forecasting is trying to understand how something changes with time.
If the values are:
100, 120, 140, 160
you can clearly see an upward direction.
But if we randomly rearrange them, the meaning changes.
That is why time is such an important part of forecasting.
Not every forecast uses the same method
There is no single forecasting method that works for everything.
Sometimes a very simple method is enough.
Imagine the number of visitors over the last three days was:
100
120
110
One simple approach is to take the average.
That gives us 110.
So 110 could become a basic prediction for the next day.
If we keep doing this as new data comes in, it is called a moving average.
The oldest value moves out, the newest value comes in, and we calculate the average again.
This helps smooth out some of the random ups and downs in the data.
But sometimes we need more than just past values.
Imagine we are forecasting electricity demand.
Temperature may matter.
The day of the week may matter.
A holiday may matter.
Previous electricity use may matter.
So a more advanced forecasting method may look at several factors together instead of only asking:
What happened yesterday?
It may ask:
When similar conditions happened before, what usually happened next?
This is where statistical models and machine learning can become useful.
Two forecasts can give different answers
Two forecasting methods can look at the same data and still give slightly different predictions.
One may focus more on recent data.
Another may pay more attention to the long-term trend.
Another may focus on seasonality.
Another may include outside factors such as weather.
Sometimes several forecasts are even combined because different methods may capture different parts of the problem.
A forecast is still a prediction
No matter how good the data is, a forecast can never be 100 percent certain.
If a model predicts 1,000 passengers tomorrow and the real number is 950, the difference between the prediction and the actual result is called forecast error.
By comparing predictions with what actually happened, we can understand whether the forecasting method is working well.
If it keeps predicting too high or too low, we need to ask why.
Maybe the data is outdated.
Maybe an important factor is missing.
Maybe the method itself is not suitable.
Forecasting is not something we do once and then forget.
As new information comes in, forecasts can be updated.
Forecasting should guide a decision
A forecast should help us make a decision, not make the decision for us.
If a forecast says demand may increase next month, that does not automatically mean production should be doubled.
There may be other things to consider such as cost, storage, supply, risk and market conditions.
So I like to think of forecasting as a guide, not a guarantee.
How forecasting is done step by step
1. Decide what you want to predict
First, be clear about the question.
What exactly are you trying to forecast?
2. Gather relevant data
Collect historical and current information that may help answer that question.
The important thing is not just having a lot of data. It should be useful and relevant.
3. Understand the data
Look for trends, patterns, seasonality, noise and unusual values.
Before predicting anything, first understand how the data behaves.
4. Choose a forecasting method
The method should fit the problem.
Sometimes a simple average is enough.
Sometimes you may need a time-series model, statistical model or machine-learning method.
5. Generate the forecast
Use the chosen method to estimate what may happen next.
6. Compare it with what actually happened
Once the real result becomes available, compare it with the prediction.
This shows how accurate the forecast was.
7. Update the forecast
As new data arrives, the forecast can be updated.
A prediction made six months ago does not have to remain the same.
8. Present it clearly
A forecast is only useful if people can understand it.
Sometimes a graph, range or simple visual works better than one exact number.
For example:
Demand may be between 900 and 1,100
can be more useful than saying:
Demand will be exactly 1,027.
The main idea
Forecasting is not about seeing the future.
It is about using what we already know to make a better prediction about what may happen next.
We look at the past, understand the trends and patterns, recognize that unexpected things can happen, and then make the best estimate we can.
The future will always have uncertainty.
Forecasting simply helps us prepare for it with more information.